Gallery
Project Overview
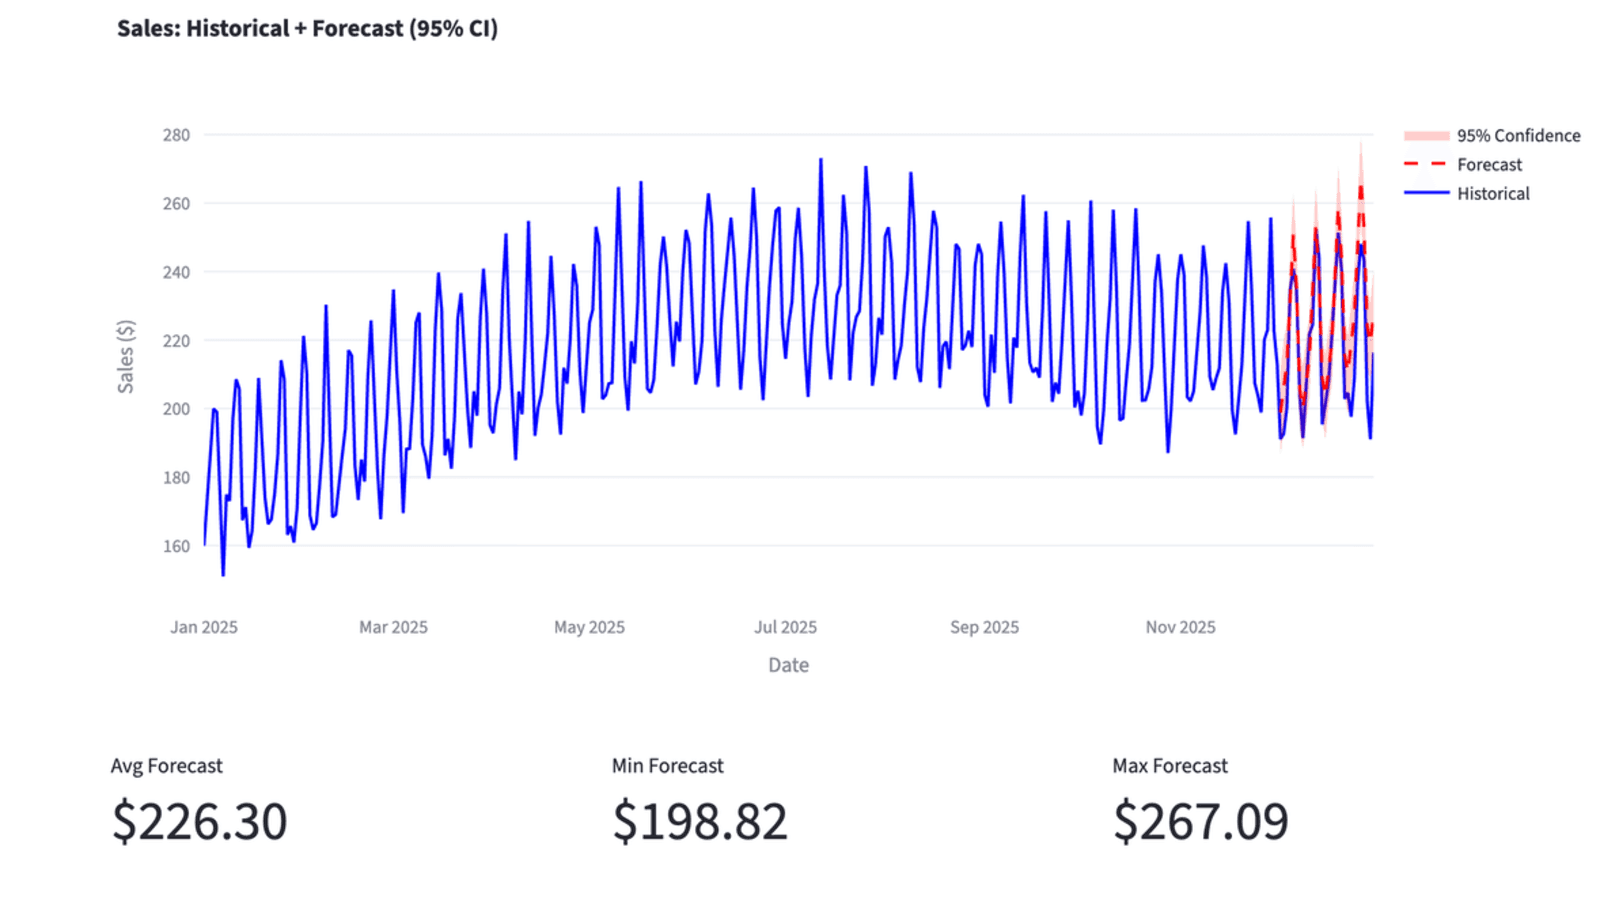
Nebluna Analytics forecasts daily demand for coffee shops. You upload a CSV of historical sales, choose how many days ahead you want to look, and get a forecast with a confidence band and the model’s error metrics.
The point of the project was not the model — Prophet is a few lines of code. The point was everything around it: taking a time series model out of a notebook and putting it behind a REST API, in a container, on managed infrastructure, with a UI that a shop owner can actually operate.
The Problem
A coffee shop’s daily sales are not flat. They have a weekly rhythm (weekends spike, Mondays sag), a slower seasonal drift across the year, and day-to-day noise on top. Ordering stock against last week’s average means over-buying on quiet days and running out on busy ones.
Prophet is a good fit for this shape of data: it decomposes the series into trend and seasonal components, tolerates gaps and outliers, and — importantly for a business user — produces interpretable uncertainty intervals rather than a single number.
Architecture
The system is split into three pieces that can be deployed and scaled separately.
Model Layer
DataProcessor handles loading, validation, and cleaning: it enforces the date / sales contract, requires a minimum of 30 days of history, and normalizes the frame into Prophet’s expected shape. DemandForecaster wraps the model itself — fitting, holding out the tail of the series for evaluation, and generating future dates with 95% confidence bounds.
API Layer
A FastAPI service exposes four endpoints:
GET /health— liveness check for Cloud RunPOST /api/v1/upload— accepts a CSV, trains the model, returns fit metricsPOST /api/v1/forecast— generates n days ahead, optionally with confidence intervalsGET /api/v1/stats— summary statistics for the loaded dataset
Requests and responses are typed with Pydantic schemas, which means the OpenAPI documentation is generated from the same definitions the service validates against. Errors are raised through a custom exception hierarchy so a malformed CSV returns a useful message instead of a stack trace.
Dashboard Layer
A Streamlit app consumes the API and organizes the output into three tabs — Historical, Forecast, and Metrics — with interactive Plotly charts. The sidebar carries the controls: CSV upload, a 7-to-90-day forecast horizon slider, and a toggle for confidence intervals.
Evaluation
The model is scored on a held-out tail of the series rather than on the data it was fit to. Three metrics are surfaced in the dashboard, each answering a different question:
- MAE — average error in dollars, the number to reason about when sizing an order
- MAPE — the same error as a percentage, comparable across shops of different sizes
- RMSE — penalizes large misses more heavily, which catches a model that is usually fine but occasionally very wrong
Showing all three in the UI is deliberate: a forecast presented without its error is a guess with a chart attached.
Deployment
The API is containerized and runs on GCP Cloud Run, built for both arm64 and amd64 so the same image works on an Apple Silicon laptop and on Google’s infrastructure. Cloud Build handles CI/CD from cloudbuild.yaml, and a budget alert caps monthly spend.
The dependency story was its own problem. Prophet sits on top of NumPy and Pandas C extensions that are fragile when conda and pip packages are mixed in the same environment. The project settles it by drawing a hard line: conda for local development, where pre-compiled binaries are reliable, and pip inside the Docker image, where Linux wheels are. The rule is documented in the README so the environment stays reproducible.
Testing
Unit tests cover both the data processing pipeline and the API endpoints — validation failures, malformed input, and the happy path — run with pytest.
Project Details
Objective
Give small coffee shops a usable demand forecast — not a notebook — by shipping the model behind a real API and a dashboard anyone can operate without writing code.
Theme
Applied time series forecasting for small-business inventory planning.
Date
August 3, 2026